AI-Driven Parcel Spend Management For Modern Operators
Unify all of your shipping data, automate invoice audits and optimize network decisions. Unlock savings on every parcel shipped.
AI-Driven Parcel Spend Management For Modern Operators
Unify all of your shipping data, automate invoice audits and optimize network decisions. Unlock savings on every parcel shipped.
AI-Driven Parcel Spend Management For Modern Operators
Unify all of your shipping data, automate invoice audits and optimize network decisions. Unlock savings on every parcel shipped.

Trusted by high-growth retailers and 3pls


Trusted by high-growth retailers and 3pls
Trusted by high-growth retailers and 3pls
Reduce parcel spend by 15-20%
Benchmark your rates, model network changes and negotiate contracts with real data.

Reduce parcel spend by 15-20%
Benchmark your rates, model network changes and negotiate contracts with real data.
Reduce parcel spend by 15-20%
Benchmark your rates, model network changes and negotiate contracts with real data.

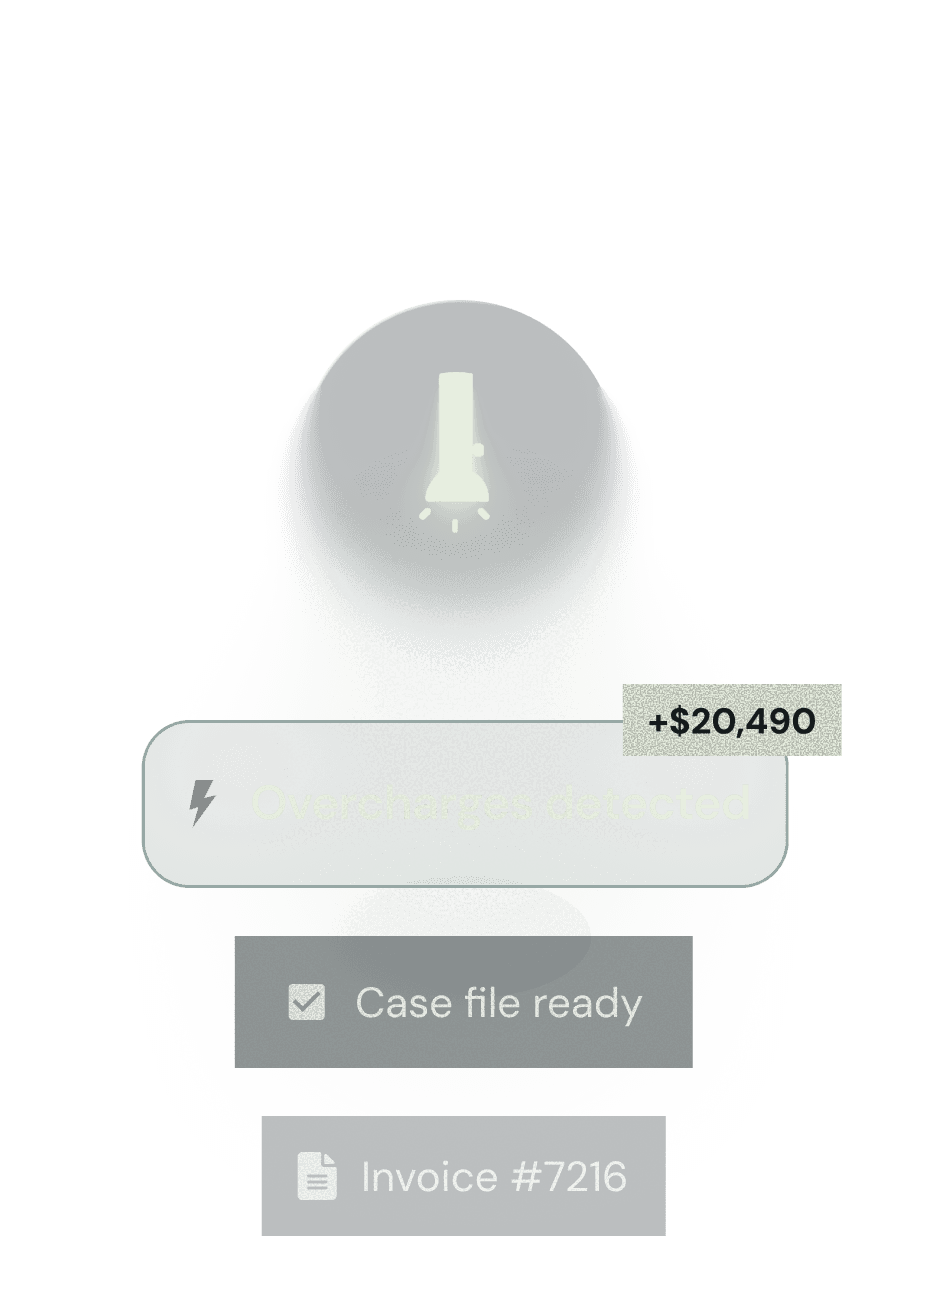
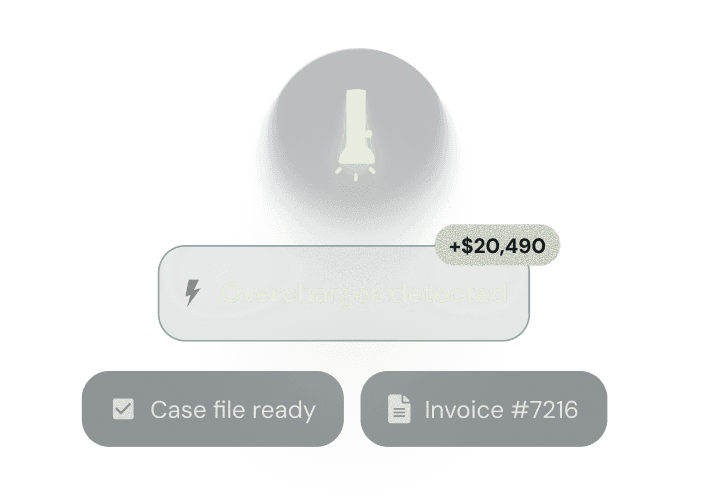
Recover 1-5% in billing errors
Catch overcharges automatically and generate ready-to-submit case files.
Recover 1-5% in billing errors
Catch overcharges automatically and generate ready-to-submit case files.
Eliminate 10-20 hours/week of manual work
Get automated audits, reconciliation and spend insights without any of the manual work.
Eliminate 10-20 hours/week of manual work
Get automated audits, reconciliation and spend insights without any of the manual work.


Built For Teams
Managing Complex Shipping Operations
Retailers
3PLs


Control and optimize parcel spend at scale
Retailers
Gain full visibility into true landed cost and spend drivers, automate invoice audits, model carrier and network changes and benchmark rates to secure stronger contracts.

Retailers
3PLs
Control and optimize parcel spend at scale
Retailers
Gain full visibility into true landed cost and spend drivers, automate invoice audits, model carrier and network changes and benchmark rates to secure stronger contracts.
Retailers
3PLs
Control and optimize parcel spend at scale
Retailers
Gain full visibility into true landed cost and spend drivers, automate invoice audits, model carrier and network changes and benchmark rates to secure stronger contracts.
Capabilities

Data Consolidation
All your shipping data, unified and ready to work.

Data Consolidation
All your shipping data, unified and ready to work.

Data Consolidation
All your shipping data, unified and ready to work.

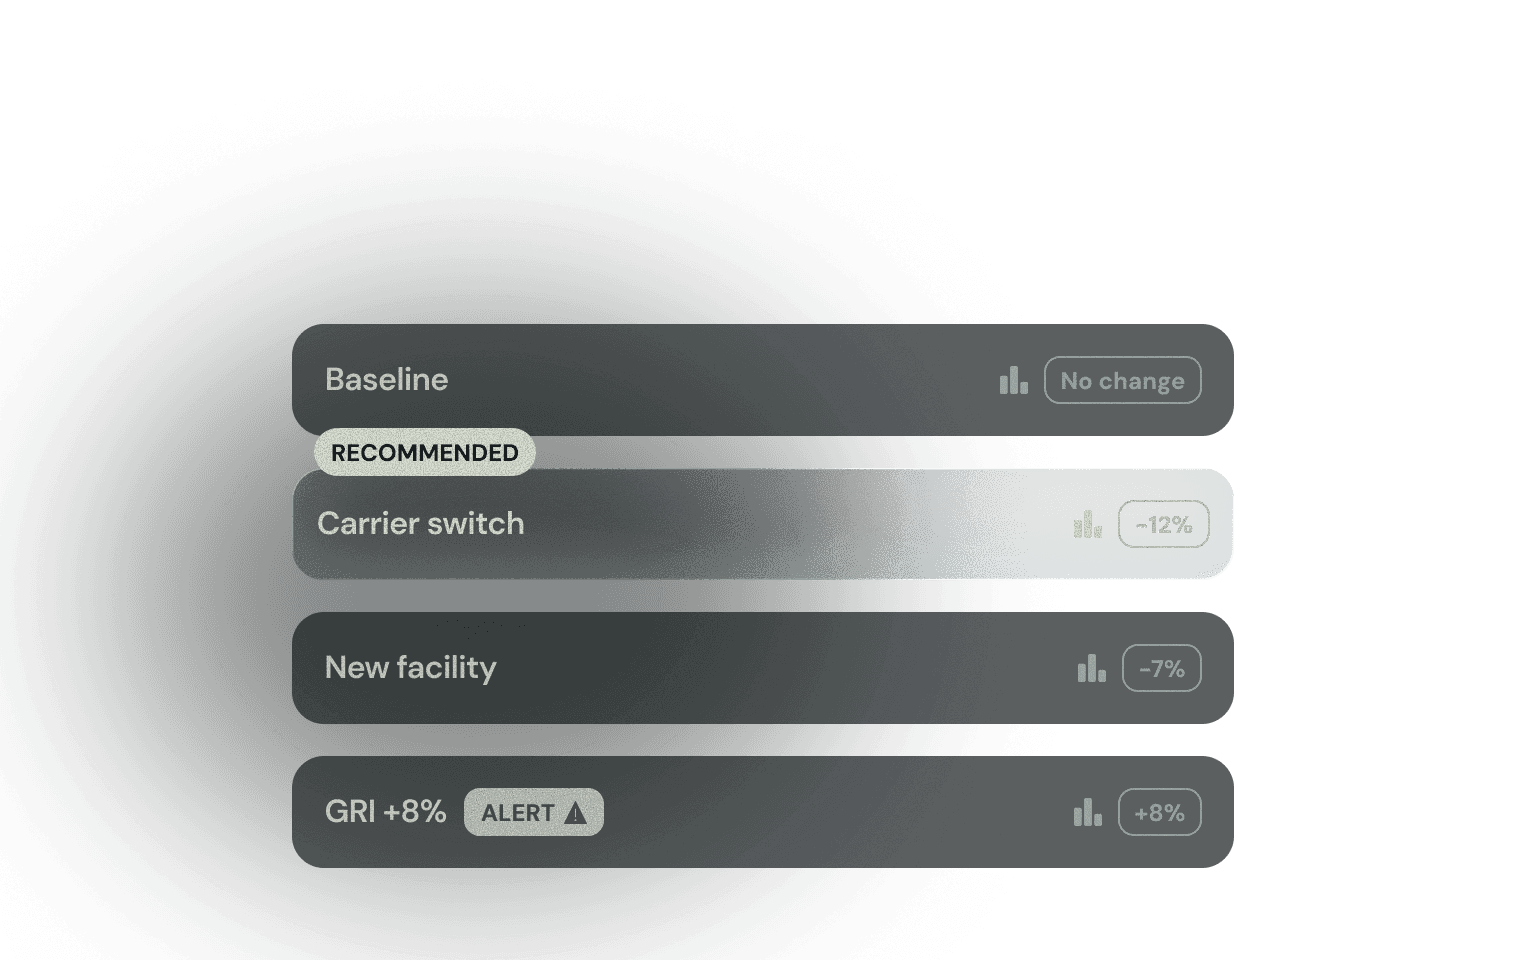
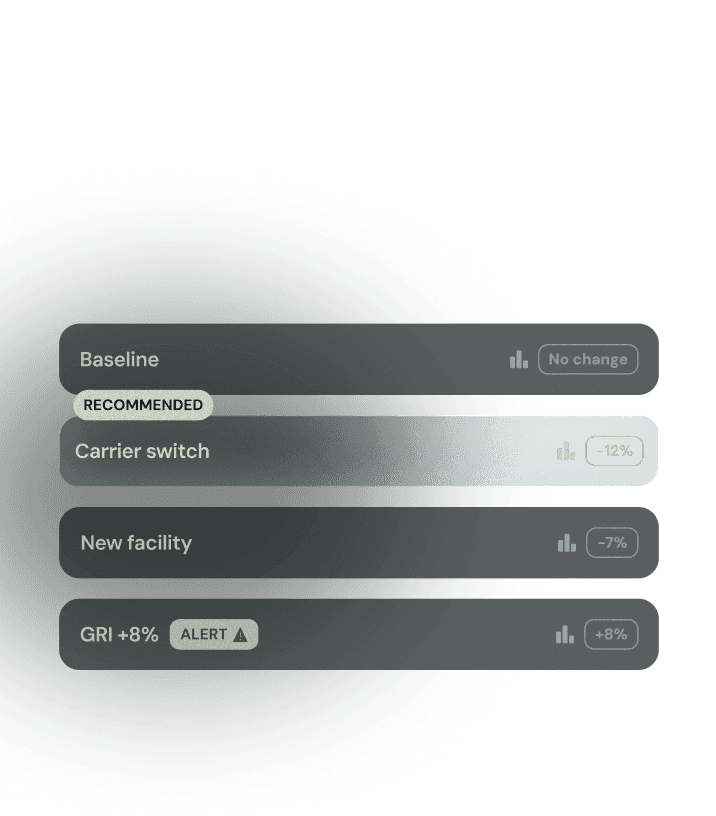
Scenario Modeling
Know the financial impact of any change before it hits your network.
Scenario Modeling
Know the financial impact of any change before it hits your network.
Scenario Modeling
Know the financial impact of any change before it hits your network.
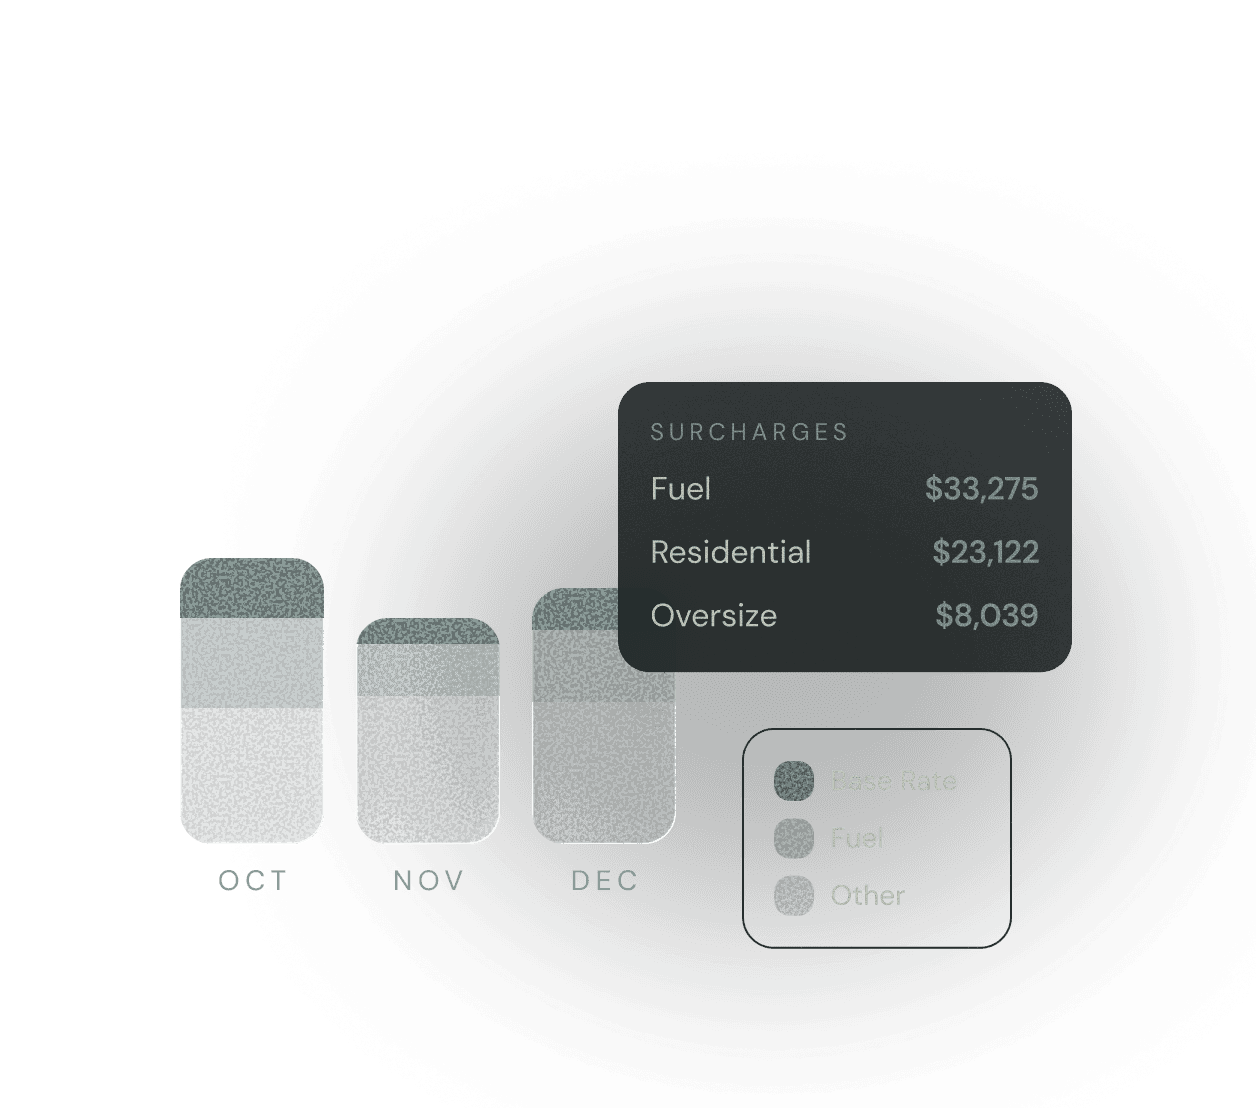
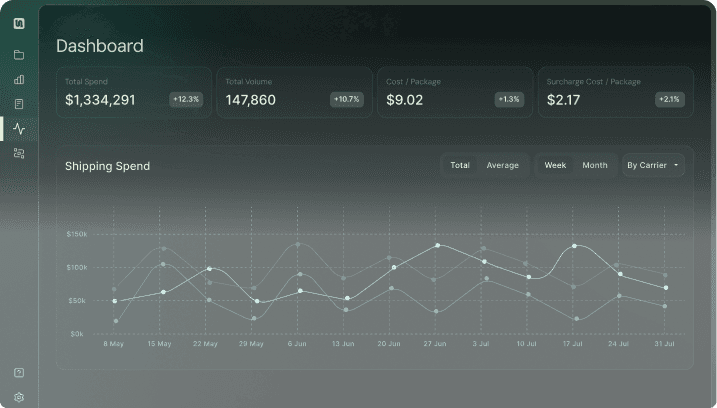
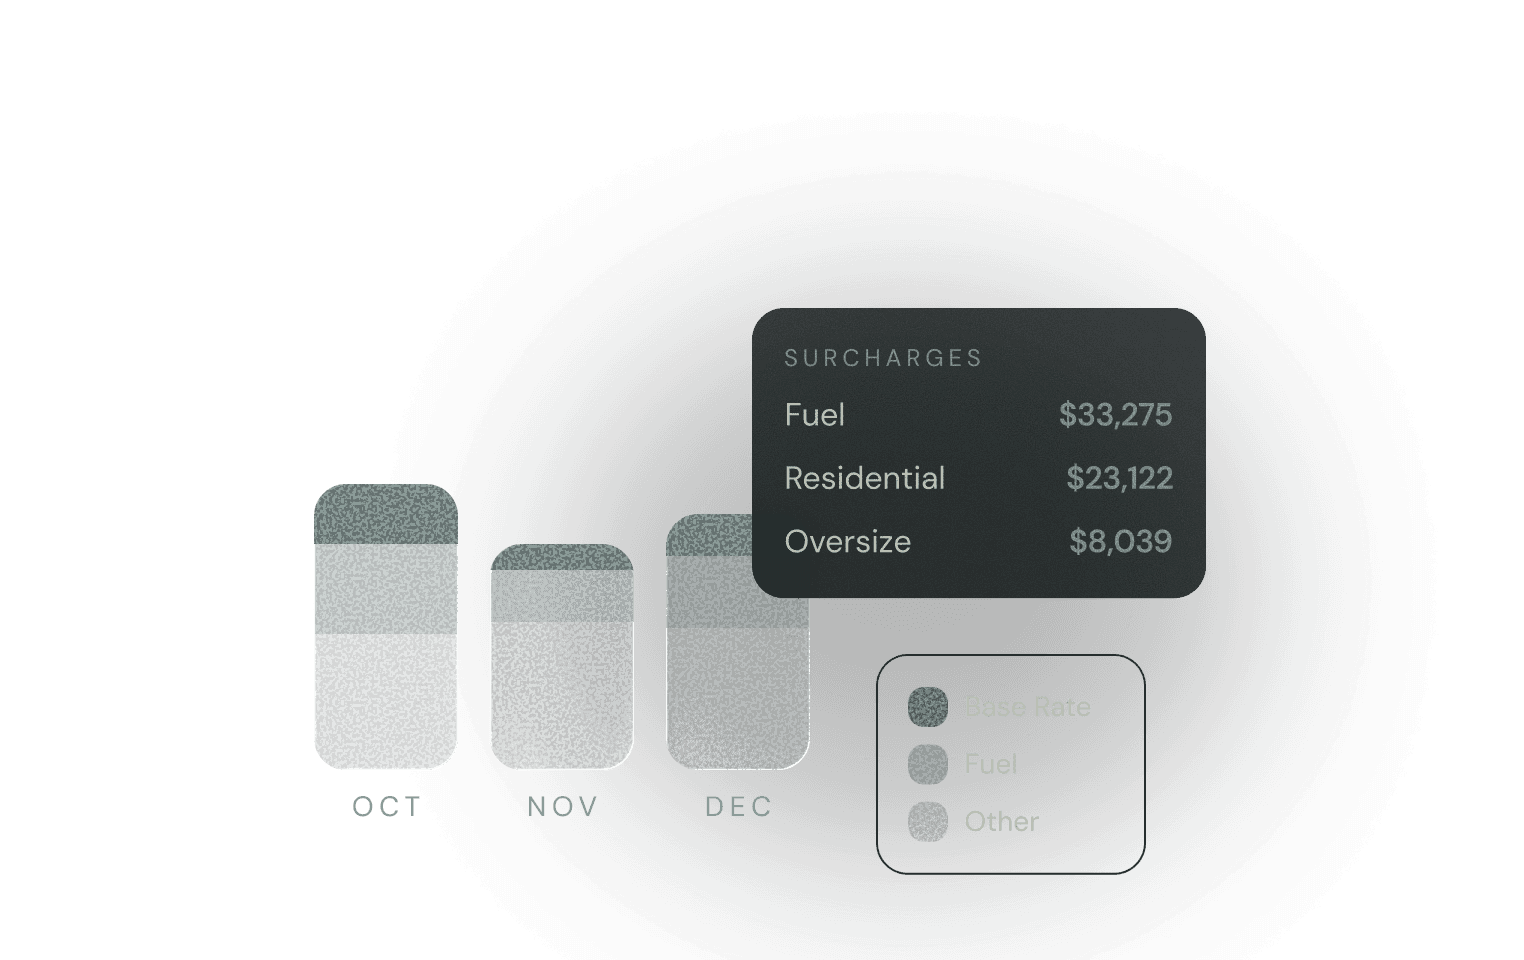
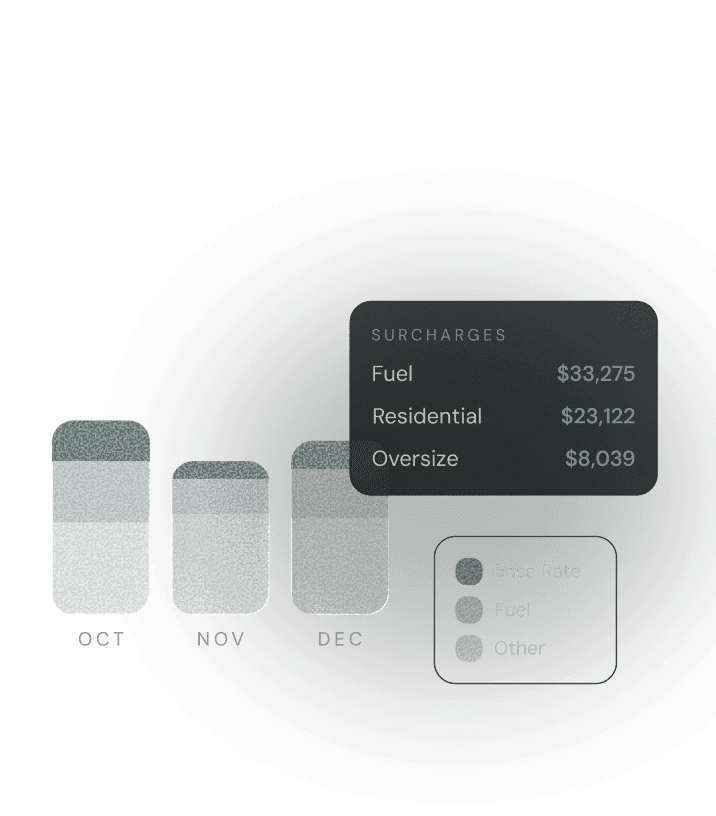
Spend Analytics & Reporting
See what you're spending and what’s driving it, in real-time.
Spend Analytics & Reporting
See what you're spending and what’s driving it, in real-time.
Spend Analytics & Reporting
See what you're spending and what’s driving it, in real-time.
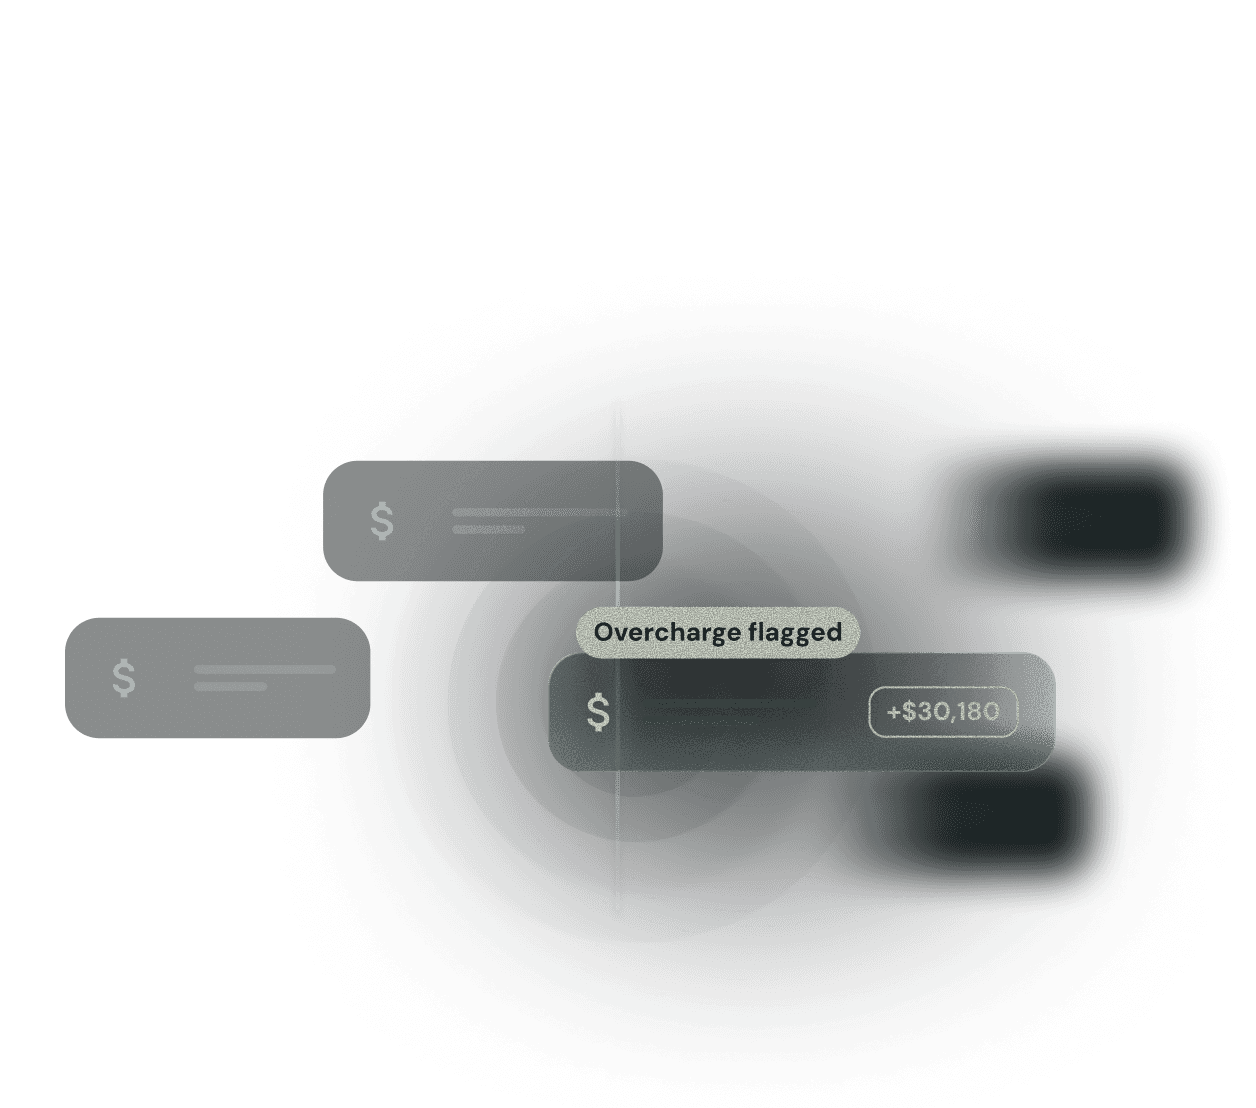
Invoice Auditing & Recovery
Catch billing errors before they hit your bottom line.

Invoice Auditing & Recovery
Catch billing errors before they hit your bottom line.

Invoice Auditing & Recovery
Catch billing errors before they hit your bottom line.

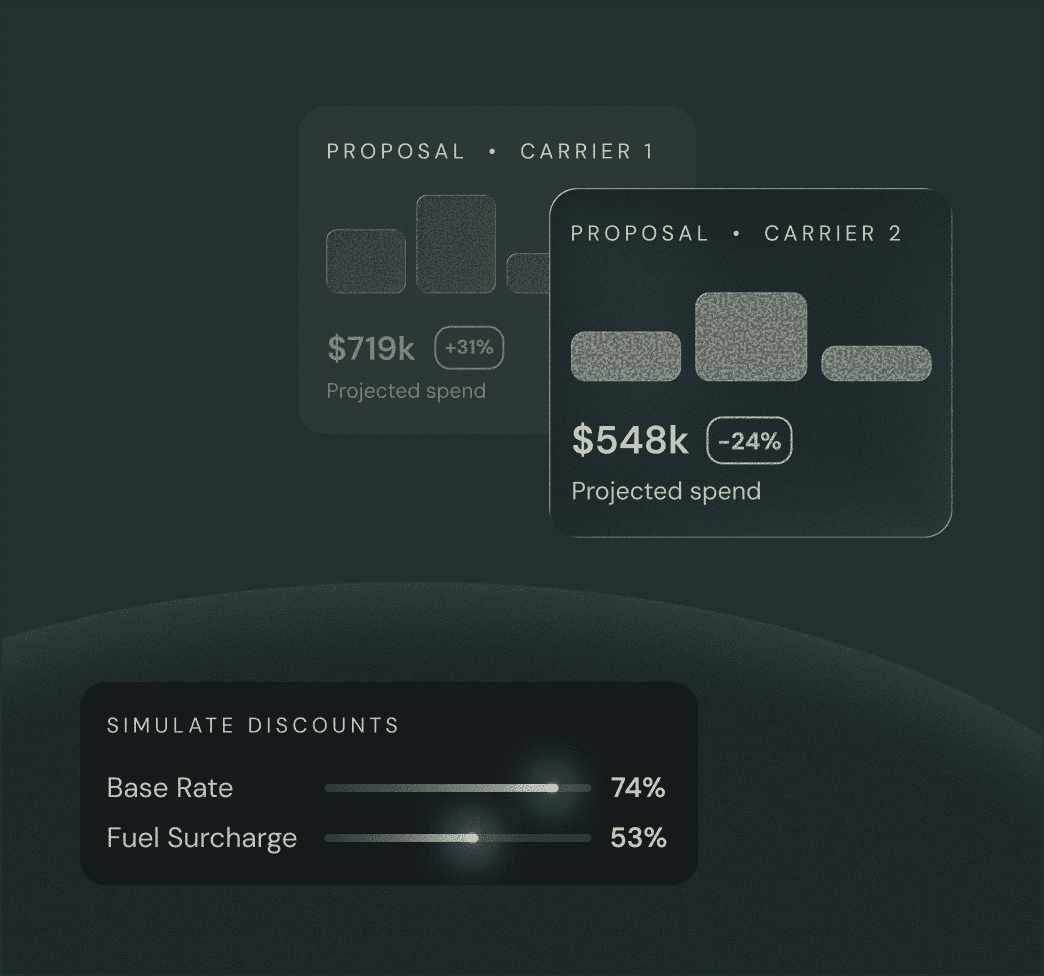
Benchmarking & RFP Intelligence
Compare RFP bids side by side, simulate any term change, and see cost impact instantly.


How Lectric eBikes Identified $1M in Billing Errors
Streamlane helped Lectric eBikes identify $1M in oversize surcharges, renegotiate carrier terms, and cut monthly shipping costs by 45%.
How Lectric eBikes Identified $1M in Billing Errors
Streamlane helped Lectric eBikes identify $1M in oversize surcharges, renegotiate carrier terms, and cut monthly shipping costs by 45%.

Get Started
See the opportunity for your operations in under a week.
Step 1
Book a 30-minute call
Tell us about your shipping operation. We'll show you exactly what Streamlane can do for you.
Step 1
Book a 30-minute call
Tell us about your shipping operation. We'll show you exactly what Streamlane can do for you.
Step 2
Share a contract and invoice
Send us a carrier contract and a recent invoice - we get it loaded instantly and set up your sandbox.
Step 2
Share a contract and invoice
Send us a carrier contract and a recent invoice - we get it loaded instantly and set up your sandbox.
Step 3
Explore your sandbox
Within days, your data is live in the platform. See contract negotiation opportunities, billing errors, and network savings specific to your operation.
Step 3
Explore your sandbox
Within days, your data is live in the platform. See contract negotiation opportunities, billing errors, and network savings specific to your operation.
Step 4
Quantify your ROI
Review real savings and process optimization based on your actual data. Decide with clarity, not guesswork.
Step 4
Quantify your ROI
Review real savings and process optimization based on your actual data. Decide with clarity, not guesswork.

From first call to full ROI assessment in under 5 days.
Make Parcel Spend Your Edge, Not Your Blind Spot
Get a tailored opportunity analysis based on your volume, carrier mix and operational model.


Make Parcel Spend Your Edge, Not Your Blind Spot
Get a tailored opportunity analysis based on your volume, carrier mix and operational model.
Make Parcel Spend Your Edge, Not Your Blind Spot
Get a tailored opportunity analysis based on your volume, carrier mix and operational model.